6 Impact Reports Worth Studying, From Nike to FREITAG
Impact reports are the hardest report category to design honestly. The company is grading its own homework, the audience ranges from regulators to sneaker customers, and the most important numbers are usually the least flattering. The gallery holds a dozen published impact and ESG reports; these six show the widest spread of approaches, from a 44-slide brand piece to a 120-slide compliance document.
Nike FY22: the brand-first impact report
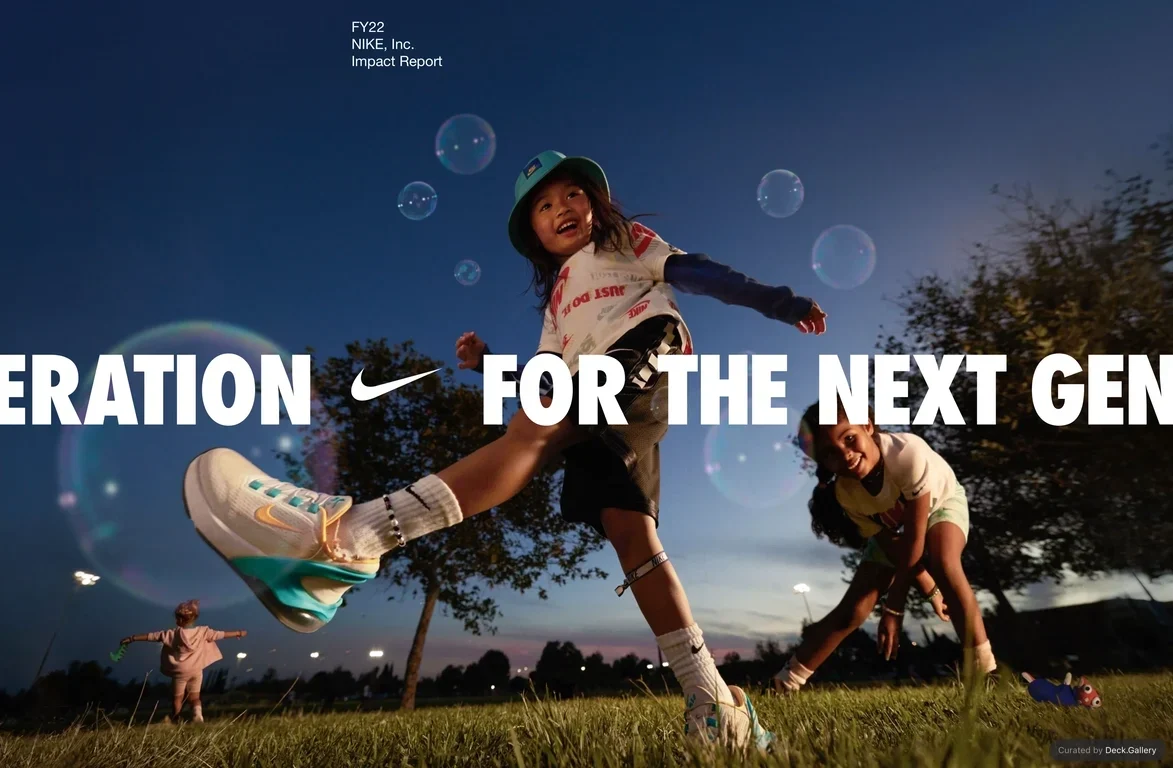
Nike's FY22 Impact Report is 44 slides and opens with a letter from athletes, not the CEO. The structure is built on four pillars with a performance summary against 2025 targets up front, then people-focused chapters where athlete profiles (Serena Williams, Megan Rapinoe) alternate with workforce data like 50% women in the global corporate workforce. It reads like a campaign that happens to carry an audit. That's the point to study: the data slides borrow credibility from the storytelling slides, and vice versa.

On 2024: putting the worst number on its own slide
On's Impact Progress Report runs 116 slides, and the bravest one states that more than 99% of On's emissions sit in Scope 3, the supply chain the company doesn't directly control. The next slide admits Scope 1 and 2 emissions rose 13% year over year. Most reports would bury both facts in an appendix table; On gives them display type. The report earns the right to its LightSpray innovation story later because it fronted the uncomfortable arithmetic first.
FREITAG 2022: circularity as an org chart
FREITAG's Impact Report structures the entire company into five circular directions, covering products, operations, services, community, and the "F-Crew." The stat that carries the deck: 99% of product output meets the company's circularity criteria. But the more instructive habit is the per-chapter scorecard; every section closes with an "achievement of targets 2022, outlook 2023" slide, including targets missed. A report that shows its misses per chapter, rather than in one easily skipped summary, is structurally harder to greenwash.
Polestar 2023: the compliance document, unapologetically
Polestar's Sustainability Report is 120 slides, and roughly the back 40 are GRI, SASB, and TCFD indices, glossaries, and methodology notes. Governance takes the first ten slides, before a single environmental metric. This is the opposite audience bet from Nike: institutional readers who navigate by disclosure framework. The design lesson is in slides like the greenhouse gas emissions by scope breakdown, where the chart formats stay identical across dozens of metrics so the reader learns the layout once.
Selfridges 2023: targets a customer can repeat
Selfridges' Project Earth Report compresses a retail group's strategy into two memorable numbers: 45% of transactions circular by 2030 and net zero by 2040. The supporting evidence is unusually commercial for the genre: resale revenue past £13m, 20,607 products carrying the Project Earth Edit label, a 17% Scope 1 and 2 reduction against 2018. Interleaved "behind the shop floor" staff interviews keep the report anchored to the retail floor rather than the sustainability office.
Lululemon 2022: the footprint chart that tells on itself
Lululemon's Impact Report organizes 16 goals under Be Human, Be Well, and Be Planet. Its key chart shows a total 2022 footprint of 1.2 million tCO2e with Scope 1 and 2 at just 0.3%, which quietly reframes the company's 100% renewable electricity achievement: the claim is real and it addresses a rounding error of the problem. Leaving both numbers on the same slide is the honest choice, and the report is more persuasive for it.
What the six share
- A targets table with a status column. Nike, On, FREITAG, and Selfridges all maintain goal-by-goal progress tables where "on track," "achieved," and "behind" sit next to each other. The table format is the genre's real spine; narrative is optional.
- Scope 3 is the tell. Every apparel and footwear company in this list has the same shape of problem: owned operations are clean, the supply chain is the footprint. You can rank the reports by how early and how large that admission appears. On puts it on slide 24 of 116, Lululemon on slide 50 of 93.
- Length maps to audience, not ambition. Nike's 44 slides and Polestar's 120 contain comparable disclosure; the difference is whether the imagined reader is a customer or an analyst. Picking one reader and designing for them beats aiming at both.
The pattern also holds at small scale: Ace & Tate's responsibility report, covered earlier on this blog, wins trust the same way On does, by admitting a failed target in display type.
Browse all report decks in the gallery for the full set, including ESG reports from Soho House, Olo, and Upwork that didn't make this six.